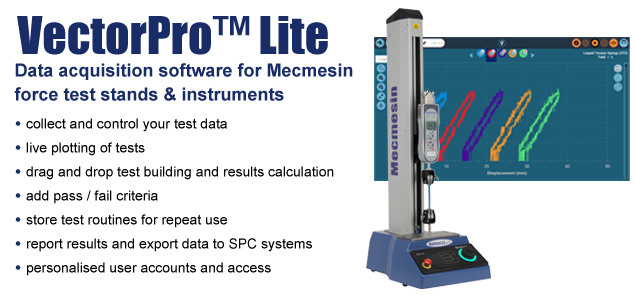
 VectorPro™ Lite Data Acquisition and Plotting Software
For MultiTest-dV and Mecmesin digital instruments (Advanced Force Gauges (AFG Mk 4), Basic Force Gauge (BFG), and AFTI).
VectorPro™ Lite enables the same basic test routines that are available through the MultiTest‑dV panel controls, to be set up and stored on a PC, with their settings, for re-use. Any single test routine can be uploaded from VectorPro™ Lite to the dV test stand, and can be run from the software to provide real-time load/displacement/time plotting.
- Live plotting of tests, with close-up graph examination. Switch axes, zoom, pan, view data point values. Offset sample traces for clarity and comparison, and add annotations. Any results can be re-viewed at any time.
- Standard calculations can be added to the test profiles to provide a selected range of results, basic statistical analysis, and pass-fail criteria for samples tested.
- Results and raw data are stored, and can be exported as .tab, .csv or Excel® files for external SPC programs, or printed in report format.
- Create personalised workspaces to simplify operations. Apply permissions to control who can access, run, edit or create tests, view results, and produce reports.
- Drag and drop all the elements needed to create a test routine, apply calculations and build reports. Create repeatable tests in moments and refine them as you go.
- Version tracking and results storage, along with customisable test summary information.
- Multi-language switching
Compatibility
Windows® 7 and later in 32-bit and 64-bit versions. Interfaces with Microsoft® Outlook 2010 or above, and Excel 2007 or above.
- Personal accounts
-
Personal accounts

- Create personalised workspaces to simplify operations
- Apply permissions to control who can access, run, edit or create tests, view results, and produce reports
- Graph mode
-
Graph mode

- View tests as they run
- Instant calculation or pass/fail results
- Switch axes, zoom, pan, view data point values
- Offset sample traces for clarity and comparison
- Add annotations for features of interest
- Any results can be re-viewed at any time
- Drag and drop
-
Drag and drop

- Drag and drop all the elements needed to create a test routine, apply calculations and build reports
- Create repeatable tests in moments and refine them as you go
- Each test profile has full version tracking and results storage, along with customisable test summary information
- Data and results
-
Data and results

- Customisable reporting function
- Compare the plots of tested samples and add spot calculations not included in the test profile
- Select out the samples you want to compare, and adjust calculation parameters temporarily or to save
- Export raw data, or results, to delimited or Excel files, email a table of results. Create a report of results, graphs and notes to print or save as PDF